Logarithmic Scale
Change the vertical axis to a logarithmic scale to analyze data that is experiencing exponential growth.
To analyze data in a different way, you can change the vertical axis of your visual from a linear scale to a logarithmic scale.
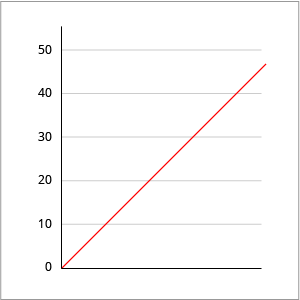
The linear scale is based on addition. For example, consider the following sequence of axis ticks: 0, 10, 20, 30, 40, 50.

To get the next tick, you add 10 to the previous number. The visual distance between ticks 10 and 20 is the same as ticks 40 and 50.
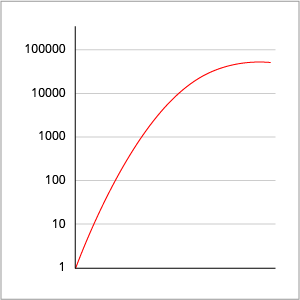
The logarithmic scale is based on multiplication. For example, consider the following sequence of axis ticks: 1, 10, 100, 1000, 10000, 100000.

To get the next tick, you multiply the previous number by 10. The visual distance between ticks 10 and 100 is the same as ticks 1000 and 10000. On a logarithmic scale, the distance between any two points on the axis does not represent the difference between metric values. Instead, the visual distance between any two points represents the difference in magnitude of the metric values.
Logarithmic scales are a good way for you to look at data that is experiencing exponential growth because:
- It will allow you to display a wide range of values, where there is a great discrepancy between the largest numbers and the smallest numbers, in one compact view.
- It emphasizes changes in the growth rate that aren't apparent on linear scales.
- A straight line indicates exponential growth.
- An upward curve indicates the rate of increase is growing (greater than exponential growth).
- A downward curve indicates the rate of increase is slowing (less than exponential growth).
For more information, see Adjust the Vertical Axis.
